Promises, promises… I like to keep mine, so after Part 1, let’s continue with Part 2.
Originally, it wasn’t my plan to have a Part 2 in the first place. When I started writing the script, it was my goal to include all checks into a single script.
I rather quickly abandoned that idea because the script became too bloated and slow. At the time, some checks that are now part of Part 2, were based on WMI queries. We all know WMI, but not for it’s speed, right?
So I decided to keep it simple, and at least start somewhere instead of keep on trying. The result is Part 1.
But I couldn’t just pass up on my original idea either.
So I decided to take the same framework (with loop, offset timer, and other parameters) and add the other tests. And at the same time trying to avoid the usage of WMI queries as much as possible.
Tests I included:
- CPU usage
- Memory Usage
- Disk Usage
- Disk queue length
In the end, I was forced to use a single WMI query, and that was needed to determine the amount of memory for a machine:
$MEMtotal = ((get-wmiobject -Computername $server -class “win32_physicalmemory” -namespace “root\CIMV2”).Capacity)
This proved to be a challenge, because that query doesn’t return a single value, but returns the value for each memory module in an array.

But what about VM’s? They have “virtual” memory modules. One per 16Gb of memory (as far as I could check). So as long as your VM has less than 16Gb, a single value is returned. When the VM has more, multiple values are returned. So I needed to find a way to cope with these different possibilities.
This is the solution I found:
$sum = $MEMtotal -join ‘+’
$MEMsum = Invoke-Expression $sum
The first line creates an expression with all array values and adds a “+” sign in between them.
The second one “executes” that expression, effectively returning the sum of all (virtual) memory banks.
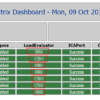
The end result is again saved as an HTML file, and I integrated that one into another IIS page using an iframe.
The end result looks something like this:

I didn’t include any logging in this 1.0 version, I wanted to assess the value of these readings first.
You can always find the most current files by going to https://www.carlwebster.com/where-to-get-copies-of-the-documentation-scripts/ and looking in the Bart Jacobs’ Toolbox section.
Stay tuned for more!
Thanks
Bart Jacobs


How do I download your Bart Jacobs’ Toolbox
https://www.carlwebster.com/downloads/download-category/bart-jacobs-tools/
Webster