It’s been a while since I posted something. To make it up to you, this is part 1 of a 2-part series on monitoring. Part 2 will be following soon, I promise.
More specifically, monitoring XenApp with Powershell.
Since many of my customers are still running 6.5 (yeah, I know), I’m focussing on that version first.
And I know that lately, others have been releasing monitoring scripts and even entire frameworks.
Yet, I still wanted to put my work out there, not because I think my scripts are better, but to give you another option, or another source of inspiration.
In this first blog post, I’m presenting my XenApp dashboard script. The script was based on the Farm Health Report by Jason Poyner, over at https://deptive.co.nz/xenapp-farm-health-report/. I reached out to Jason at one point, and he was ok for me to base my script on his script and even publish it. But he certainly deserves some credit too.
Basically, it comes down to this. The original script is a one-off, meaning, the script produces an outcome and that outcome is mailed or otherwise made available. But that’s it, once the output is there, the script is done.
I wanted something more like a dashboard. So I built a loop around the script and scheduling at server boot. So the script would continuously generate output. Output, in this case, an HTML file, that I would integrate into another website using your everyday iframe.
But that wasn’t the full solution because I wanted data to refresh faster. Since I couldn’t find a way to run through the server checks faster, I worked on the only alternative I could think of: the looping of the script. So I introduced an offset parameter, allowing me to start the script at a given time (sleep) interval. And I would schedule multiple script launches at server boot, each with their won offset. So let’s say if it takes 60 seconds on average to check all servers, I would schedule a script with offset 0 and 30. So when the first script finishes after 60 seconds, the second one will finish approximately 30 seconds later.
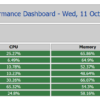
This has worked really well for me, producing output like:

As you all know, using server silos is a popular implementation of XenApp 6.5. So that’s the final parameter I added. You still need to include the logic for the silo naming, however. For example, you could include all servers starting with “BE” in a silo etc.
Versions 1.0 and 1.1 of the script were never published out in the open, but I’ll tell my story on them anyway. They are about logging to CSV. In 1.0, there was no logging, only a “real-time” dashboard. In version 1.1, a CSV per server was generated containing date/time, the number of active sessions and the server load. In version 1.2, the version I’m “releasing” today, at every offset 0, I would add data of servers to a “datacenter CSV” file, a file containing all data of the data center. Those CSV’s can be used to drive PowerBI or Excel PowerPivot stuff.
Again, I’m not trying to convince you my script is any better than those already out there. It’s not. I only hope that it would give you some food for thought and even some inspiration.
You can always find the most current files by going to https://www.carlwebster.com/where-to-get-copies-of-the-documentation-scripts/ and looking in the Bart Jacobs’ Toolbox section.
Stay tuned for more!
Thanks
Bart Jacobs


Bart, Am not familiar with the term Silo in this context but assumed it meant the AppCenter folder containing the servers one wishes the script to query. So I proceeded on that interpretation but am not getting anything yet.
In this case I want to access all servers whose names begin with VWT in the TEST folder under Servers in AppCenter in my XA6.5 Farm.
# Silo Parameter
# The script is started with an identifier of the Silo of servers you are monitoring. This section parses that parameter and populates some variables
accordingly
# More silo’s -> More
if ($silo -eq “Servers/TEST”)
{
$serversilo = “VWT*”
$silotitle = “XenApp Producion Silo Citrix Dashboard”
$siloerrortitle = “XenApp Production Silo Error Report”
}
I tried it without using “Servers/” as a preface to TEST, but that was how the exclusion list was built in the original Webster/Poyer script.
Hi Tom,
Silos were used in the context of a group of servers that belong together. There no direct relation to a Worker group or a folder in Appcenter.
What is comes down to is populating the $sservers array with the servers you want to test. I did this through a “silo” variable, but this can really be anything you want.
Bart,
Yes. Works great. Did not see up front how simple it is to just supply a parameter at the command line. And as long as that is the same word you designated in the IF statement you’re good to go and then can use wildcards to filter on the server names you want. Really like it. A lot. Not to sound ungrateful but am sorry to see the vDisk info is missing in this evolution of the original Poyner script. But again, mucho thanks – TK
Xenapp Health Script and Monitor zip files under download is bad.
I deleted and uploaded the files again.
Webster
Hello Carl,
I am having the same issue as Mike when trying to download XenAppServerHealthCheck_v1.2.zip.
Thanks,
Try it now.
Webster
Works perfect, thanks Carl!
XenAppServerHealthCheck this script i am not finding, please help me to get that script
https://www.carlwebster.com/downloads/
look in bart jacobs’ toolbox
webster